Here’s a short story (from this Wikipedia page) showing why getting position size right is very important:
In one study, each participant was given $25 and asked to bet on a coin that would land heads 60% of the time. The prizes were capped at $250. "Remarkably, 28% of the participants went bust, and the average payout was just $91. Only 21% of the participants reached the maximum. 18 of the 61 participants bet everything on one toss, while two-thirds gambled on tails at some stage in the experiment. Neither approach is in the least bit optimal." Using the Kelly criterion and based on the odds in the experiment, the right approach would be to bet 20% of the pot on each throw. If losing, the size of the bet gets cut; if winning, the stake increases.
Anyway, after developing a new strategy, optimizing it then finally running something like Kelly% on it you might end up with an equity curve that looks like this:
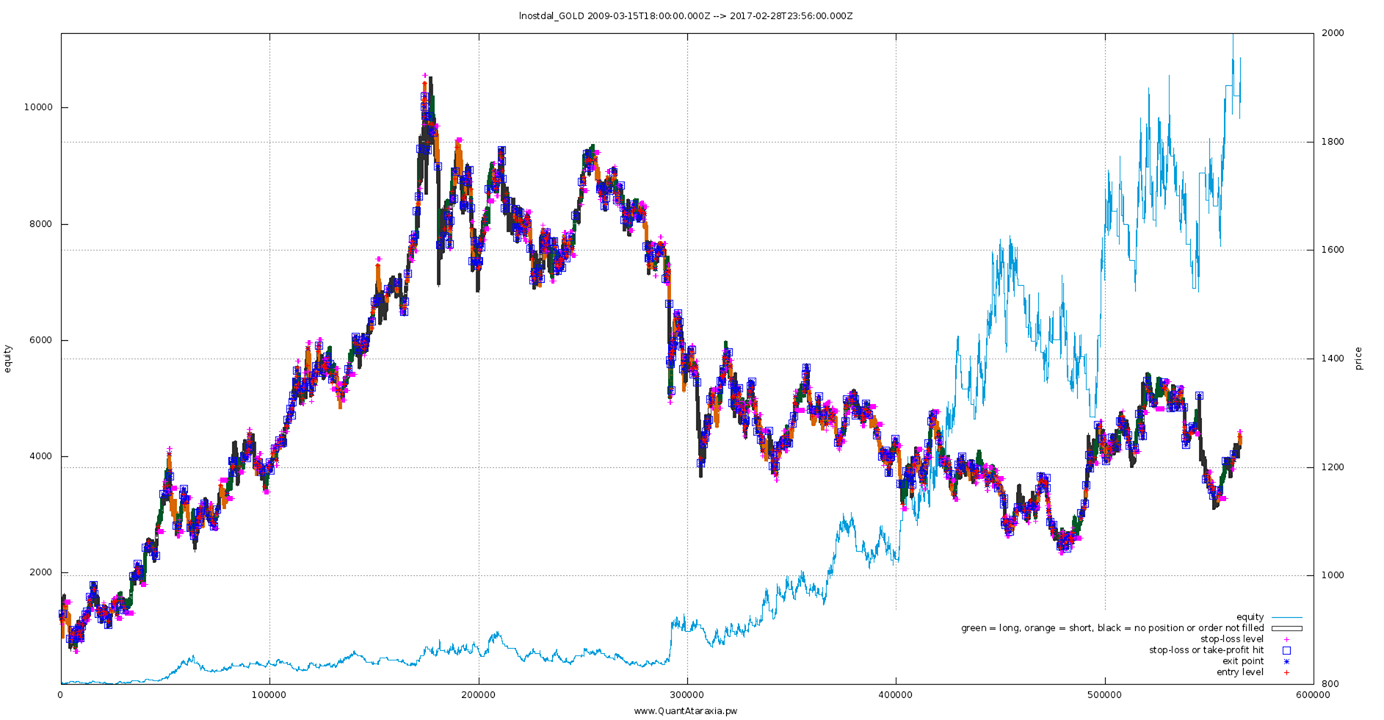

..much nicer! For some curves, log makes eyeballing things like the momentum of your returns much easier which might give you hints about a possible curve fit problem or similar – so this is not simply about aesthetics.
Happy weekend and trading!
No comments:
Post a Comment